


Video consumption has changed more in the last five years than in the previous 50, yet media plans have not. But as Facebook’s Dan Sinfield explains, a new comprehensive study of consumer behaviour by PWC shows it’s time to change that thinking.
It’s easy to try and guess the motivating factors for consumers when it comes to their media choice. For example, what do you think the biggest factor determining what people see as a quality video platform?
It’s not being ad free (that was fourth), it’s not how much Aussie content it has (3rd), it’s actually the range of content it has available.
And what are the content categories people most want to see? Despite dominating the TV ratings every year it’s not sport or reality TV (5th and 6th respectively), people are actively seeking out more drama and comedy content.
The basic rules of how you plan your media buy haven’t changed over the years if you want to maximise your ad dollars, and there are three things critical to success: reach (how many people you can speak to) + low wastage (minimising the amount of people who aren’t potential category buyers you speak to) + frequency (how many times you speak to them, and what times of day).
The problem is, with no single-source of truth it’s really hard for anyone planning and buying media to actually get to grips with what Australians are actually doing. So Facebook tasked PWC with getting a deeper understanding of what Australian consumers are actually doing, and their reasons behind it.
There are a few commonly held beliefs and theories in market we wanted to test in the real world. For example:
What impact has subscription video on demand (SVOD) services like Netflix and Stan had on consumer habits?
Are the TV networks broadcast video on demand (BVOD) services, helping to offset the 23% drop in prime time viewing they have experienced since the arrival of Netflix?
And how different are the consumption habits amongst the young and old, and do you need completely different strategies to reach the majority of them?
Below I’ve outlined a few questions, and some supporting evidence, you need to start asking before you construct a media plan, if you want to make your media more effective and efficient.
1. Where are people watching video?
When planning any campaign it’s important to know where consumers can be found. The research found there are five big beasts in the video jungle (for people over 14), Free-to-air TV (FTA) (17.3m), Facebook (17.3m), YouTube (16.6m2), Netflix (11.3m) and Instagram (11.3m2).
Whilst TV is on par with Facebook in terms of overall audience, it is worth noting it would require a media buy across all the free-to-air networks and regions to reach that audience, as opposed to a single buy on the commercialised digital channels.
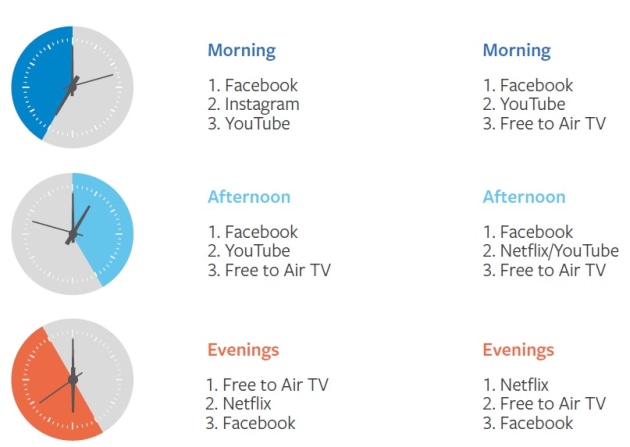
It’s also interesting to note when people are consuming their media, so we asked people what their preferred platforms were at different times of the day. Netflix has shaken up the industry being the second most popular channel on weekday evenings behind FTA, and the preferred channel on weekend evenings ahead of FTA. Facebook was the preferred channel during the day when people are on the move, and third choice in the evenings.
2. Streaming has changed the way people are looking for entertainment
In just five years Netflix has become the fourth largest video platform in the country with 11m users. In the US it already takes more than 8% of all commercial video minutes. This is of course not immaterial for marketers, because the platform is completely ad free.
People are consuming more video content, and are comfortable watching it across a variety of screens - 3 on average. Whilst 57% of people watch video on a TV screen, 51% are using a mobile, 42% a laptop, 33% an internet-connected TV and 32% on a tablet.
It’s also impacted what people look for when they are thinking about what video channels they use. A wide range of content is important for the majority (75%) whilst convenience appeals to 67%. Unique content was a factor for just 37% while, encouragingly for non-subscription channels, just 32% cited an ad-free experience as a driving factor in this choice.

What people are seeking out to watch is also an important driver. SVOD has driven its popularity by ‘owning’ three of the top four most popular genres in the minds of consumers with drama, comedy and documentaries appealing. FTA staples news, sport and reality were the second, fifth and sixth most popular respectively.
3. The myth of BVOD
TV networks are hoping to attract new audiences with their own digital video, or BVOD, offerings, allowing people to access their content for free, in exchange for watching ads (encouragingly not a turn-off for two-thirds of people as yet).
The research shows BVOD is actually only having a minimal impact in augmenting the existing audiences for TV networks, with an average of 75% overlap between existing FTA viewers and people watching BVOD. For comparison, the deduplicated audience respectively of Facebook (17.3m2), YouTube (16.5m2) and Instagram (11.1m2) dwarves the largest deduplicated BVOD audience, which is 9Now (2.8m).
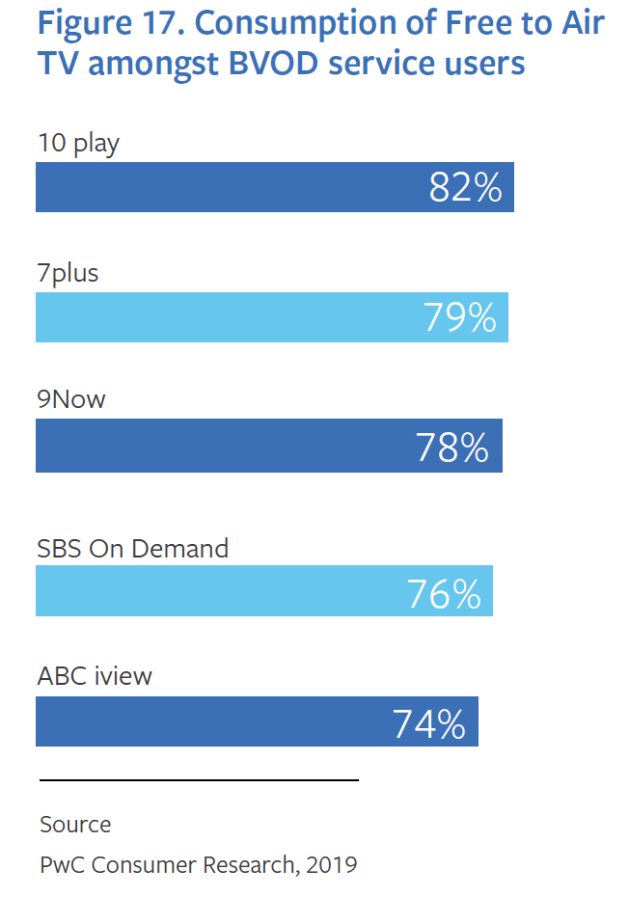
Whilst the TV marketing organisation, ThinkTV, is suggesting BVOD creates ‘incremental’ reach for their TV buys, this data suggests they are in fact largely reaching the same audiences watching a catch-up service, and paying an additional cost at a premium to reach the audience in what is often a pretty bad consumer experience.
4. How does all this vary by age?
It is interesting to note there are still some marked variations in consumer behaviour, with under 55’s moving more rapidly away from FTA to digital video than audiences over 55.
Across all demographics under 55 Facebook and YouTube were the most prevalent channels in that order, with Facebook nearly at saturation point across all of them.
FTA jumps to the top of the list in the oldest demo we looked at, people aged 55+ with 95% penetration, but Facebook and YouTube were the next biggest with 89% and 83% respectively.
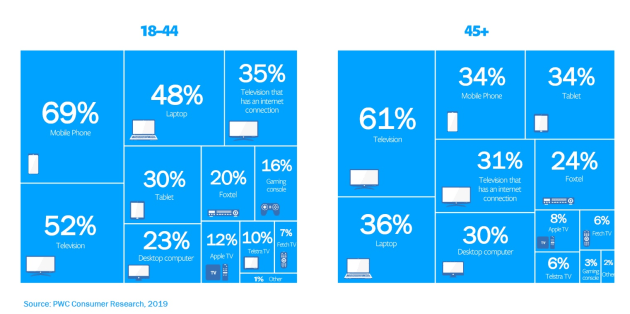
For under 45s mobile (69%) is by far the biggest screen with TV mopping up 51%, while the loungeroom widescreen is king of the screens for older demos (61%) with the mobile gaining 34%, the same as the tablet and just behind laptops (36%).
How often when targeting predominantly under 45s are we thinking "how do we talk to our consumer on mobile as the primary channel rather than a supporting one", even as an afterthought ?
A few conclusions
There is no silver bullet, the requirements for every brand are unique. But for most there is a need to reach your potential category buyers the right amount of times to generate brand awareness and/or sales.
But this report shows a simple fact. For the vast majority of media plans, selecting multiple channels at varying weights is the right approach, but too often we are starting at a default, historic place rather than where contemporary consumers are spending their time.
We’re stuck in a traditional mindset. Mass reach for all target audiences is still being delivered through free-to-air TV channels first and foremost. Where there’s acknowledgement this reach has diminished, it’s being replaced by BVOD, which this report shows is effectively the same audience again.
The approach to planning has to start with consumer behaviour, and this has changed so much that tweaking what you have done for the last few years no longer reflects Australian media habits.